
PDF to podcast: choose the pages and definitions first
Choose the pages that answer one question, then retain the details that change the meaning of a figure.
PDF audio gets easier to check when you choose the pages before you choose the voice. A short adaptation does not need every line of a public report. It does need the definitions, dates, units, caveats, and table notes that make its claims interpretable.
A source brief tells the audio writer which parts of the PDF answer the question and where the listener can check a claim. The example below uses a public statistical bulletin with page references, definitions and data notes.
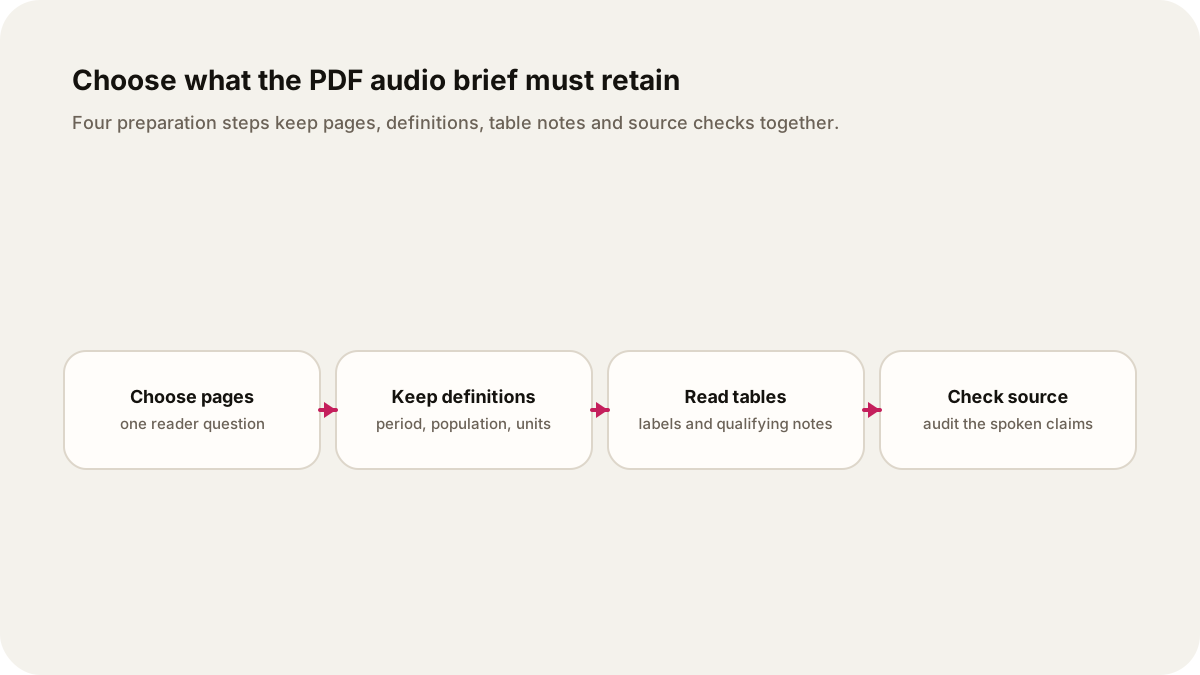
1. Choose the pages that answer one question
Start with one listener question and a short page range. “What does the May 2025 UK well-being bulletin report, and how does it define its measures?” names both a document and a task. A request to cover every line of a long report leaves those choices to the narrator.
Write down the PDF title, publisher, release date, page count, and the pages you selected. Then give each page a job:
- the opening page for the report's scope and main points
- the page with the result or decision that answers the question
- the page with the glossary or definitions
- the page with data sources, quality notes, and limitations
An official example shows why this matters. The Office for National Statistics bulletin on measuring progress, well-being, and beyond GDP is nine pages. Its main points are on page 2, the personal well-being measures begin on page 3, the glossary begins on page 7, and data sources and quality begin on page 8. A short audio brief can use those pages without pretending that the other pages do not exist.
2. Keep definitions beside the numbers
In the ONS example, personal well-being uses four measures: life satisfaction, whether things feel worthwhile, happiness, and anxiety. The questions and their 0 to 10 response scale appear in the glossary on page 7. A higher anxiety score means higher reported anxiety, while higher scores on the other three measures describe better reported well-being.
Those details belong in the audio. A listener who hears “22.6 percent reported high anxiety” also needs the period, population, and meaning of “high.” The bulletin reports UK adults in October to December 2024 and defines high anxiety as a score from 6 to 10. It also reports that 26.2 percent of women and 18.8 percent of men reported high anxiety in that period, with a statistical significance qualification. Those are not decorative footnotes. They set the boundaries of the claim.
For every number you keep, record:
- what is being measured
- who or what is included
- the period and geography
- the unit, scale, or threshold
- whether the figure is an estimate, a revision, or a comparison
If you cannot answer one of those questions from the selected pages, mark the claim for checking instead of filling the gap from memory.
3. Keep the table's labels and notes
Tables and charts often carry the comparison that makes a report useful. Before adapting one, identify its row or series, column heading, unit, time period, denominator, and notes. Decide what a listener needs to hear and what can remain in the linked PDF.
The May 2025 bulletin compares the estimate it reports with one year earlier and five years earlier. It explains this on page 3, then gives the underlying percentages on page 4. A brief can name one or two comparisons, state the quarter, and point the listener to the page. It should not read every cell of the chart or imply that a visual trend proves a cause.
Keep a table note when it changes interpretation. In this bulletin, the data sources and quality section says the release brings together different geographies, sampled populations, and time periods, so comparisons need care. It also says some survey estimates may not represent people who do not live in private residential households. That limitation belongs in a short adaptation of the statistics.
4. Check the source after the draft
Give the listener a way to audit the audio. Keep the report link, the exact page references, and a short claim ledger with the wording you used. Check the draft against the PDF after writing, especially numbers, dates, quoted terms, and any sentence that connects two facts with a reason.
Here is an illustrative brief using the ONS bulletin:
Use the ONS “Measuring progress, well-being and beyond GDP in the UK: May 2025” PDF. Answer: what does the bulletin measure, and what should a listener know before comparing its well-being figures? Use pages 2 to 4 for scope and reported results, page 7 for the four questions and thresholds, and pages 8 to 9 for data coverage and limitations. Explain the 0 to 10 scale, name the October to December 2024 period, and include one comparison with its percentage and population. Do not read the chart cell by cell. Say when the bulletin combines different geographies, sampled populations, or time periods. End with the page numbers and the source link so I can check every figure.
The brief has a bounded question, named pages, retained definitions, a table rule, and a check at the end. If the document is a policy or public report, keep its effective dates, exceptions, scope, and stated authority in the source ledger. A short audio adaptation can explain the document, but it should not quietly turn a suggestion into a rule or a summary into a complete substitute for the source.
Lissin can make a personal audio show from supplied PDFs and documents. Keep the page references and claim checks in the source brief because the article does not promise OCR, faithful table reproduction, or metadata extraction. For a report that affects work, money, health, or a civic decision, keep the original PDF beside the audio and read the relevant passage yourself.
When the PDF is a research paper
A research paper needs a different page plan from a statistical bulletin. Articles reporting original research are usually divided into introduction, methods, results, and discussion. The ICMJE recommendations, written for medical journals, call this the IMRAD structure and give each part a job that a source brief can use:
- Abstract. It should state the study's purpose, basic procedures, and main findings. ICMJE notes that the abstract is the only part many readers read, so treat it as the starting point for the brief, not a substitute for the paper.
- Methods. ICMJE asks for enough detail that others with the data could reproduce the results. For audio, keep who or what was studied, how it was measured, and what it was compared with.
- Discussion. ICMJE asks authors to state the study's limitations. Put those limits beside the result they qualify instead of saving them for a closing warning.
A brief for a paper might read:
Use this paper to explain its research question to a curious beginner. Take the question and main finding from the abstract, then explain the method in plain words: who was studied, what was measured, and what it was compared with. Keep the authors' stated limitations next to the result. Separate what the study measured from the authors' interpretation, and do not read equations or table cells aloud. End with the section names I should read myself.
Keep the figures, equations, and exact definitions in the paper. A spoken explanation can introduce a method, but it cannot replace a graph or a statistical model you may need to inspect. If a finding matters to your work, check the sentence in the results section before repeating it.
Sources
- Office for National Statistics: Measuring progress, well-being and beyond GDP in the UK: May 2025: HTML bulletin with release date, measures, data notes, and glossary.
- ONS bulletin PDF: nine-page source used for the page references in this guide.
- Lissin on the App Store: published source and document input description for the iPhone app.
- ICMJE, "Preparing a Manuscript for Submission to a Medical Journal": the IMRAD structure and what abstracts, methods, and discussion sections are expected to contain.
- Listening versus reading a long article: deciding when exact wording matters more than a compressed briefing.
- How to verify an AI-generated news summary: a claim-by-claim source check for spoken summaries.