
Percentage points and percent change, explained aloud
A 10 percentage-point rise is not automatically a 10% rise. State the old value, calculate the point difference, then compare the change with the starting value.
“Up by 10 percent” and “up by 10 percentage points” can describe different changes. The first compares the size of the change with the starting value. The second subtracts one percentage from another. In a chart, report, or audio briefing, state the old percentage, the new percentage, the point difference, and the relative change.
The Office for National Statistics style guide defines a percentage point as the difference between percentages. It gives a useful test: a value of 10% falling by one percentage point becomes 9%; a fall of 1% would make it 9.9%. The figures in the examples below are hypothetical learning data, not official statistics.
Percentage points are a subtraction
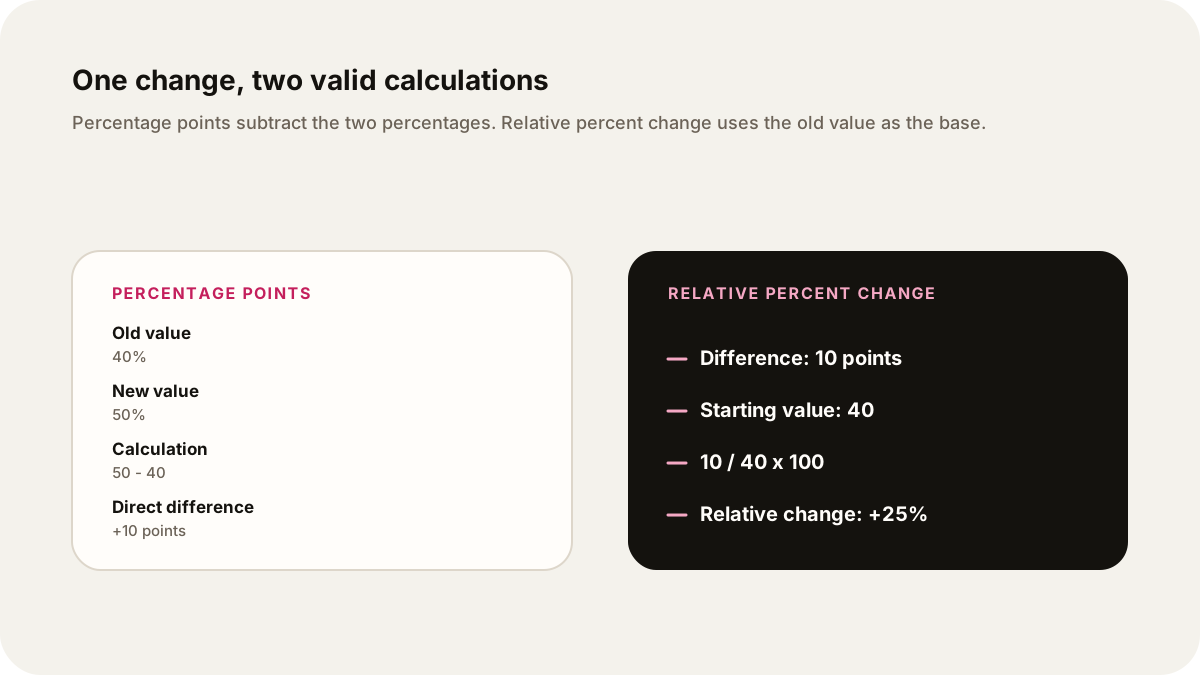
Suppose a hypothetical class survey records the share of learners who choose an audio revision guide. In week one, 40% choose it. In week two, 50% choose it. The percentage-point change is:
new percentage - old percentage
50% - 40% = 10 percentage points
That tells the listener the gap between the two shares. It does not say that the share grew by 10% relative to its starting level.
The same distinction works for a fall. If a hypothetical completion share drops from 60% to 45%, the change is 45% minus 60%, or minus 15 percentage points. Say “down 15 percentage points” when you mean the direct difference between the two percentages.
Relative percent change uses the starting value
Relative percent change asks how large the difference is compared with the old value:
(new - old) / old x 100
(50 - 40) / 40 x 100 = 25%
So the hypothetical move from 40% to 50% is an increase of 10 percentage points, or a relative increase of 25%. Both statements are correct because they answer different questions. The starting value matters. Ten points added to 40% is a quarter of 40; ten points added to 80% is one eighth of 80.
For the fall from 60% to 45%, the relative change is:
(45 - 60) / 60 x 100 = -25%
That is a 15 percentage-point fall and a relative decrease of 25%. If the starting value is zero, relative percent change is undefined because the formula divides by zero; report the direct change instead. Keep the direction in the wording so a listener does not mistake the minus sign for a separate statistic.
Use the denominator before you compare
A percentage is a share of a defined whole. The hypothetical 40% and 50% figures are useful only if both weeks count the same kind of response and use the same denominator. If week one counts all invited learners but week two counts only respondents, the subtraction may still be mathematically easy while the comparison is poorly framed.
An audio script should name the denominator: “Among the 200 learners who answered in each week, the share selecting the guide rose from 40% to 50%.” That sentence gives the listener the group before giving the change. If the denominator changes, describe that change before calculating. Do not make a larger claim than the data supports.
A short spoken template
Use this four-part sentence for a clear comparison:
- “The old value was 40%.”
- “The new value was 50%.”
- “That is an increase of 10 percentage points.”
- “Relative to the old value, it is a 25% increase.”
An example Lissin request could be: “Explain this table for a general listener. State the denominator, report the old and new percentages, calculate the percentage-point difference, then calculate relative percent change using the old value. Keep the data labelled as hypothetical and say when rounding changes the result.”
When a source uses rounded percentages, preserve its displayed precision and avoid implying more accuracy than the source gives. The ONS guide recommends using the same number of decimal places within a sequence. Put the formula in the episode notes or a linked transcript if the audience may want to check the arithmetic.
For a broader audio learning routine, audio study guides versus flashcards compares two ways to review material. Public lecture listening syllabus shows how to structure a longer learning sequence.
Sources
- Office for National Statistics, Percentages and percentage points: the distinction between percentage points and percentage change, with examples and formatting guidance.
- Office for National Statistics, User guide to population and demographic statistics: context for denominators and interpreting population percentages.