
Sound pitch vs. volume: frequency, amplitude and Hz explained
Frequency tells you how fast a sound cycles. Amplitude and sound pressure describe the size of its pressure change, while pitch and volume describe what a listener hears.
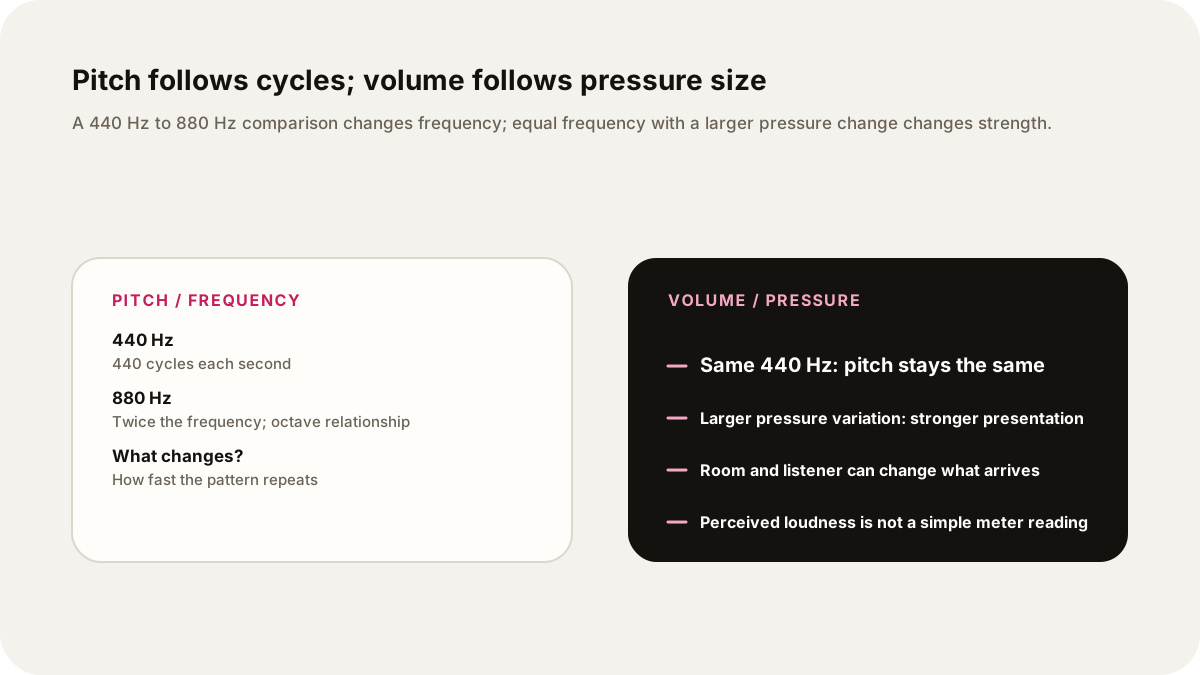
If two notes sound equally high but one is easier to hear, their pitch has stayed the same while their volume has changed. If a note moves from 440 Hz to 880 Hz, its frequency has doubled, so the pitch moves up by an octave in the simple example below. Frequency describes how fast a sound repeats; amplitude and sound pressure describe the size of the pressure change that reaches the listener.
Pitch and volume answer different questions
Pitch answers “how high or low does this sound seem?” Volume answers “how strong or quiet does it seem here?” NASA describes the physical pair in similar terms: people associate a sound’s frequency with pitch and its amplitude, or intensity, with loudness. The listener’s experience is not a perfect one-to-one readout of the physics. Frequency, duration and the listening environment can all affect how loud a sound seems, as the National Institute on Deafness and Other Communication Disorders explains.
That gives you a practical separation:
| Question | Physical quantity | Common unit or description |
|---|---|---|
| How fast does the repeating pattern cycle? | Frequency | Hertz (Hz), or cycles per second |
| How large is the pressure variation around ordinary air pressure? | Amplitude, often described through sound pressure | A pressure change; sound-level systems may express it in decibels |
| How does the sound seem to a listener? | Pitch or loudness | A perception shaped by the signal and the ear |
Frequency and pitch are related, but they are not interchangeable words. Frequency is a measurable property of the sound wave. Pitch is the auditory impression associated with it. Amplitude and sound pressure are also physical descriptions; “volume” is the everyday control or impression we use when we want a sound to be stronger or quieter.
What frequency and hertz mean
Frequency counts repeats in a fixed time. One hertz means one cycle per second. Ten hertz means ten cycles per second. NIST defines Hz as the measure of the frequency of oscillations and identifies frequency as the property of sound that determines pitch. In a simple tone, a higher number of cycles per second corresponds to a higher pitch, and a lower number corresponds to a lower pitch.
An octave is a useful relationship between frequencies. The upper frequency is twice the lower one. The NASA sound handbook describes an octave band this way, and a physics lesson uses the same 2:1 relationship for musical notes.
Suppose a hypothetical tone is 440 Hz. That number means 440 cycles per second. A second hypothetical tone at 880 Hz completes twice as many cycles per second. In this simplified musical comparison, 880 Hz is one octave above 440 Hz. These numbers explain the relationship; they do not mean that this article generated or played either sound.
What amplitude and sound pressure mean
Sound is a moving pattern of compression and rarefaction in a medium such as air. The pressure rises a little above ordinary atmospheric pressure and falls a little below it as the wave passes. Amplitude describes the size of that variation. Sound pressure is the pressure difference between the air without the sound and the total pressure while the sound is present. The NASA handbook’s introduction to sound defines sound pressure in those terms.
For a steady, simple tone, increasing the amplitude makes the pressure swings larger while leaving the cycle rate unchanged. That is the physical change behind a louder version of the same pitch. The speaker, room, distance and listener also matter, so a source setting is not a universal report of what every person will hear.
You may see sound pressure level reported in decibels. This article leaves the logarithmic calculations aside because they are not needed to tell pitch from volume. If you need the measurement details, NIDCD explains that sound intensity or sound pressure is commonly reported in dB and that the scale is logarithmic. Adding dB values as if they were ordinary linear numbers gives the wrong result; the NASA handbook notes that two independent sound sources each at 70 dB combine to about 73 dB, not 140 dB. A 3 dB increase describes a change in measured level, not a promise that a listener will experience twice the loudness.
Two comparisons that keep the variables separate
Here are two hypothetical comparisons. Treat each line as a description of a signal, not as a recording or listening test.
Same pitch, different volume
Imagine signal A and signal B both repeat at 440 Hz. Signal B has a larger pressure amplitude at the listener’s position. The two signals have the same frequency, so their pitch is the same in this simple example. Signal B is the stronger or louder presentation. Turning up a playback control often aims to make this kind of change.
Doubled frequency, same illustrative level
Imagine signal C at 440 Hz and signal D at 880 Hz, with the same illustrative pressure amplitude. Signal D repeats twice as often. The frequency has doubled, so the simple octave relationship predicts a higher pitch. Equal amplitude in a diagram does not guarantee equal perceived loudness, because ears respond differently across frequencies and the room can change the pressure that arrives at the listener.
The short version is: changing the vertical size of the pressure variation changes strength; changing the number of cycles per second changes frequency. A real instrument or voice usually contains several frequencies at once, so its tone colour can change even when one frequency or level is held constant.
A listener-friendly way to explain a sound
When you turn a sound question into a personal audio brief, name the variable before giving the number. “The pitch is set by frequency, measured in hertz. The 440 Hz example has 440 cycles per second.” Then separate the second operation: “The volume changes when the pressure variation is larger or smaller at the listener.”
For a Lissin request, try: “Explain pitch and volume for a general listener. Define frequency, hertz, amplitude and sound pressure. Compare two hypothetical 440 Hz signals at different levels, then compare 440 Hz with 880 Hz as an octave relationship. Identify the comparisons as hypothetical, and keep physical measurements separate from what a listener perceives.” Keep the source material beside the resulting brief so the numbers remain traceable.
For another source-to-audio workflow, see how to explain a chart aloud. If you want to check the source trail in a generated briefing, source links and corrections in AI-generated audio gives the editorial questions to ask. Listening versus reading a long article covers a separate text-and-audio workflow and keeps the original source beside the audio.
Keep the distinction visible
Use Hz when you mean cycles per second. Use amplitude or sound pressure when you mean the size of the pressure variation. Use pitch and loudness or volume when you mean the listener’s experience. A 440 Hz tone can be made stronger without becoming a higher note; an 880 Hz tone can be quieter than a 440 Hz tone if its pressure variation is smaller.
Those two axes are enough for the basic question. Add waveform shape, spectrum, room acoustics or decibel arithmetic only when the listener’s question requires them. The NASA science of sound overview is a useful next source for the broader distinction between frequency, amplitude and the medium that carries sound.
Sources
- National Institute on Deafness and Other Communication Disorders explains, checked October 9, 2026.
- NIST defines Hz as the measure of the frequency of oscillations and identifies frequency as the property of sound that determines pitch, checked October 9, 2026.
- NASA CR-3406, Handbook of Aircraft Noise Metrics (1981), checked October 9, 2026.
- NASA science of sound overview, checked October 9, 2026.