
Mean or median? An audio explanation with a worked dataset
The mean keeps every value in the calculation. The median keeps the middle position visible.
When someone asks for the “average,” ask what they want the number to represent. The mean uses every value and can move sharply when one value is unusually large or small. The median uses the middle position after sorting, so it can describe a typical case when the ends of the list are far apart. A spoken explanation becomes clearer when it gives both the calculation and the reason for choosing one.
Mean and median answer different questions
The arithmetic mean is the sum of the values divided by how many values there are. The median is the middle value in sorted data. With an even number of values, it is the average of the two middle values. The NIST Engineering Statistics Handbook gives both definitions and notes that extreme values in the tails can distort the mean while leaving the median based on rank.
Use the mean when the total matters. If six people split a dinner bill, the mean bill answers, “What amount would each person pay if the total were shared evenly?” If you are estimating a total budget, a mean that includes every bill may be the useful summary. The mean is also a natural fit when the data are roughly symmetric and no single value dominates.
Use the median when the middle person's experience matters and extreme cases would pull the mean away from most observations. Median rent, delivery time, or commute length can give a better picture of a typical case when a few unusually high values sit in the list. NIST notes that for a symmetric distribution the mean and median can be similar, while skewed data can separate them.
A worked dataset makes the choice visible
Consider these eight hypothetical delivery times in minutes, already sorted:
| Observation | Delivery time (minutes) |
|---|---|
| 1 | 18 |
| 2 | 19 |
| 3 | 20 |
| 4 | 21 |
| 5 | 22 |
| 6 | 24 |
| 7 | 26 |
| 8 | 90 |
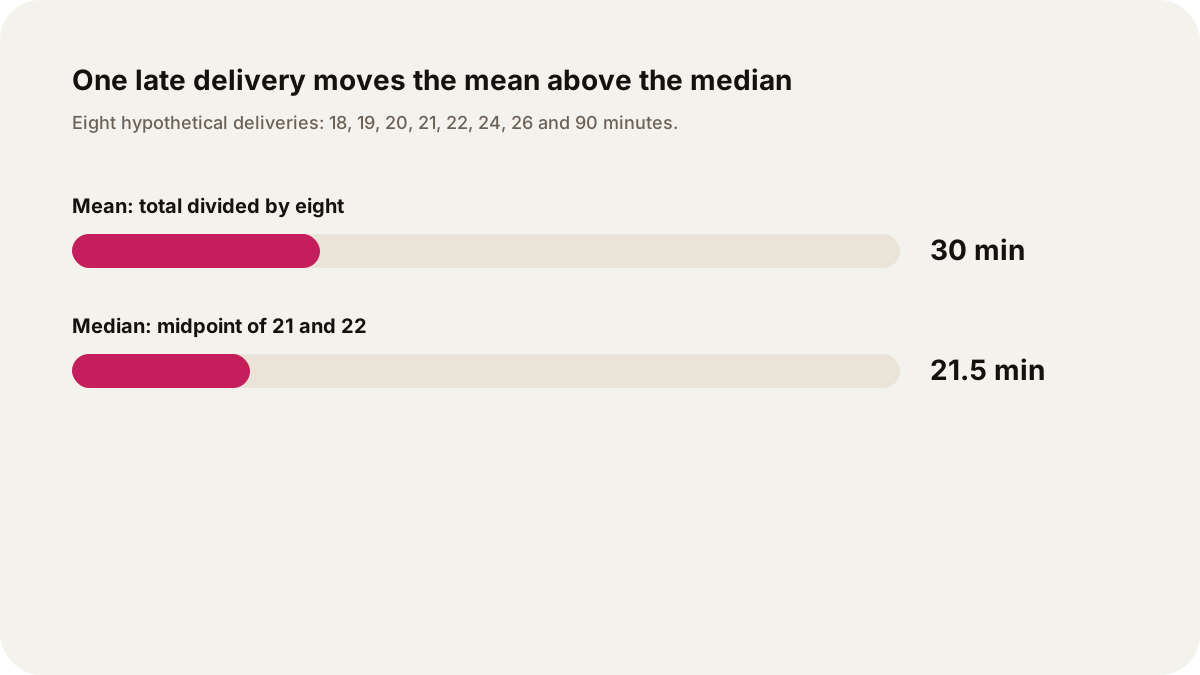
The mean is 240 divided by 8, which is 30 minutes. The median is the mean of the fourth and fifth values, 21 and 22, which is 21.5 minutes. Seven of the eight deliveries took 26 minutes or less, so 30 minutes does not describe the middle delivery very well. It does answer a different question: the total time divided equally across all eight deliveries.
The 90-minute delivery is not automatically an error. It may be a real late order, and removing it would change the question. If the aim is to report the typical delivery, say “the median was 21.5 minutes, while the mean was 30 minutes because one delivery took 90 minutes.” If the aim is to plan total driver time, keep the 90-minute value in the mean and explain that the mean is 30 minutes.
An audio script should say the list is hypothetical and show the arithmetic in words: “For these eight invented delivery times, the mean is thirty minutes. The median is twenty-one and a half minutes because the two middle values are twenty-one and twenty-two.” A listener can then follow the choice instead of treating one number as the universal answer.
A quick decision for real data
Start by sorting the values or inspecting a plot. Ask whether the data have a long tail, a few genuine extremes, or a practical reason to preserve every value. Report both mean and median when the gap between them carries information. A large gap can alert a reader that the distribution is skewed, though it does not by itself identify the cause.
Keep the unit attached to the statistic. “Median of 21.5 minutes” is clearer than “median 21.5.” Name the number of observations, the time period, and any exclusions. A median of eight deliveries is not interchangeable with a median of eight thousand deliveries, even if the values happen to match.
For a Lissin show, try this example request: “Explain this dataset for a general listener. Sort the values, calculate the mean and median, identify any extreme value without deleting it, and state which statistic better answers the question about a typical observation. Include the unit, sample size and a sentence explaining what the other statistic still tells us.”
For more listening-friendly data practice, see how to explain a chart aloud, listening versus reading a long article, and the public lecture listening syllabus.
Sources
- NIST/SEMATECH Engineering Statistics Handbook: Measures of Location: definitions of mean and median, and guidance on skewed data and extreme values.
- NIST/SEMATECH Engineering Statistics Handbook: official handbook overview and statistical reference context.